· Sam Zadworny · Tutorial · 2 min read
How to include anything in Grafana
Learn how to enhance your Grafana dashboard by embedding any web-accessible content using the Text panel and an iframe. This guide provides step-by-step instructions and a simple fix to enable HTML support, creating a seamless user experience with everything in one place.
Introduction
Many people have added InfluxDB and Grafana to their setup, but there’s one major problem - you still need to switch between screens or windows to view various apps. I’ve got solution for it …let me show you how to display anything in Grafana. And ‘anything’ means things that you can access from your web browser. All you need to do is just add a new Text panel to your Grafana dashboard, use “iframe” block in the content, and apply one little fix to Grafana ini file. Result: better user experience, because you have everything in one place. It’s more like a workaround, but it works perfectly well. Details below.
Instruction
Login to Grafana, and add a new panel: click the first button on the top-right hand corner titled
Add panel, and thenAdd new panelblue button in the new box.
Now focus on the setting in the
Panelsection on the right-hand side. First, insert any title you like inSettings. Then scroll down toVisualisationtab, and chooseTextplugin.
Below that in the
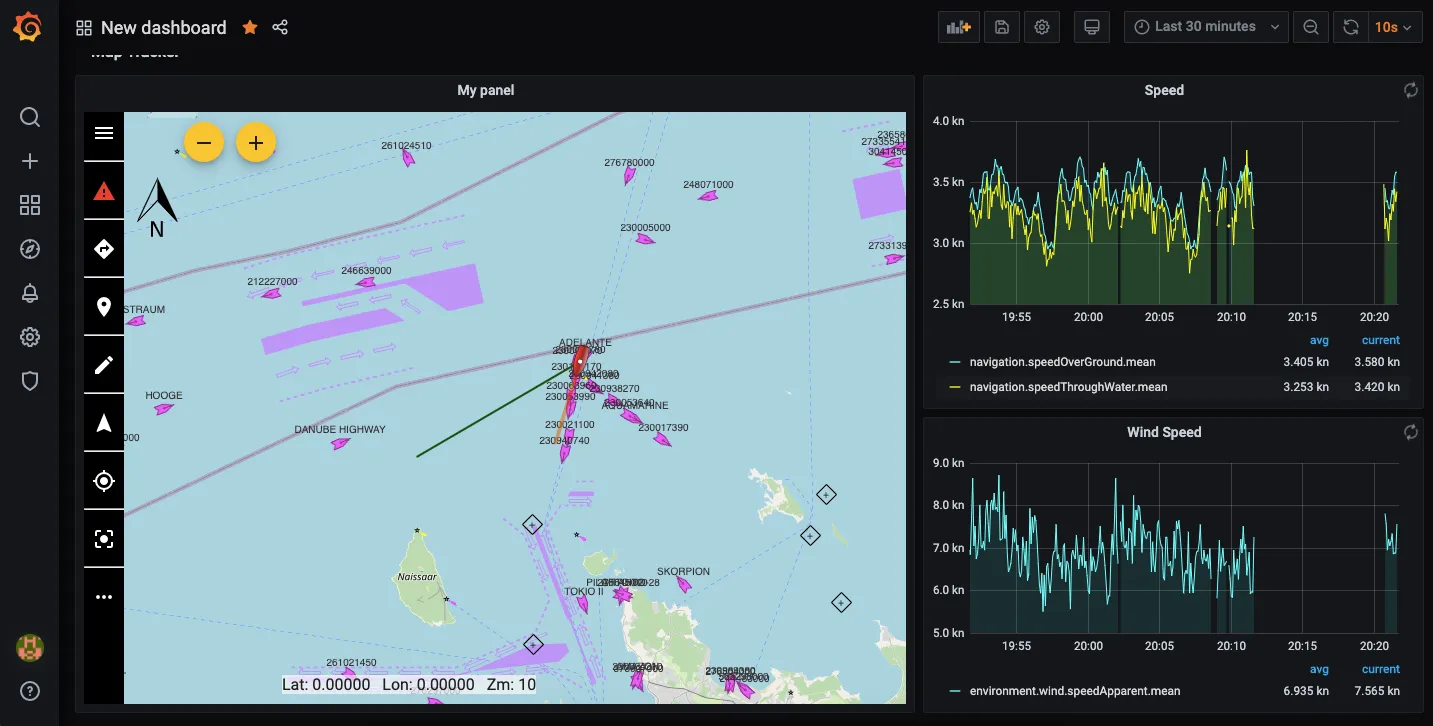
Displaysection, selectHTMLmode and insert the following in theContenttextarea:<iframe src="http://localhost:3000/@signalk/maptracker/" title="Map Tracker" style="width:100%; height:100%; padding:0; margin:0; border:none;"></iframe>In the src="" insert an URL address of your choice - http://localhost:3000/@signalk/freeboard-sk/ is just for the tutorial purposes. Click the blueApplybutton on the top-right hand corner to save the changes.
Click
Save dashboard- the second button on the top-right hand corner
You can add more panels like this, and organise your dashboard however you like.
FIX: The Grafana’s Text plugin may not work with HTML code by default, and you may need to fix it in 3 simple steps:
- Open Grafana ini file, it’s usually located in
signalk_volume/grafana/conf/defaults.ini - Find
disable_sanitize_htmlvalue and change it fromfalsetotrue
- Save the file and restart Grafana
- Source: https://github.com/grafana/grafana/blob/v6.0.0/CHANGELOG.md#breaking-changes-1